

Key Takeaways
Option A
Renting
The flexible, lower-commitment path.
Best for: Families who need mobility, want predictable monthly costs, or are not yet financially ready for homeownership.
Option B
Buying
The long-term wealth-building route.
Best for: Families with stable income, adequate savings, and a plan to stay in one place for at least five to seven years.
If you plan to move within the next three to four years
Renting
Closing costs and transaction fees when selling typically run 8 to 10 percent of the sale price, making short-term ownership financially difficult to recover from.
If you have a stable income and plan to stay put for seven or more years
Buying
Over a long horizon, principal paydown and home appreciation can build meaningful equity, provided upfront costs are fully accounted for.
If your savings cover less than a 10 percent down payment plus three to six months of reserves
Renting
Buying underfunded puts families at financial risk; a thin cash cushion leaves no room for unexpected repairs or income disruptions.
If you live in a high price-to-rent ratio market such as San Francisco or New York
Renting
In markets where home prices are very high relative to rents, the math often favors renting and investing the difference.
If your household needs flexibility for job changes or family growth
Renting
Renting allows a household to respond to life changes without absorbing the financial friction of a home sale.
The costs that make the comparison more complicated than it looks
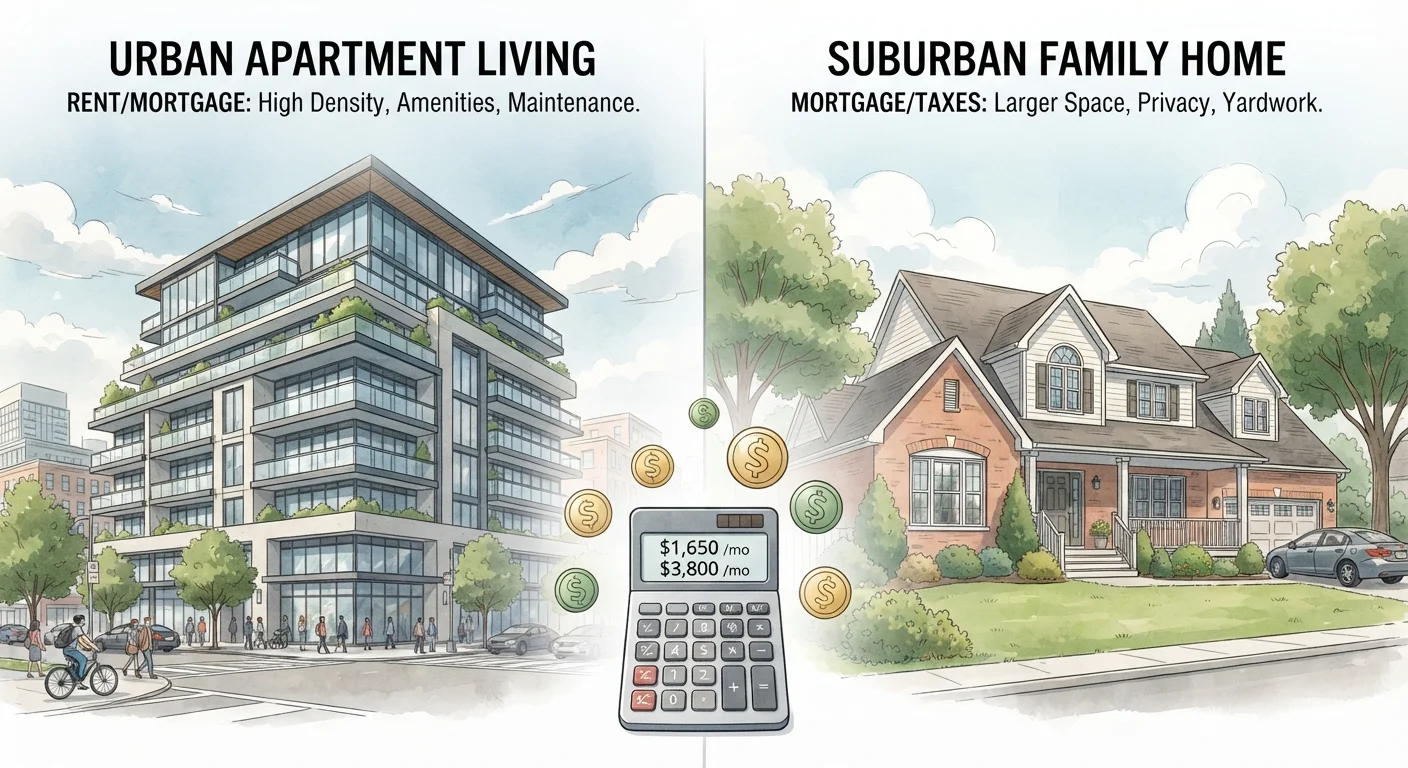
Most families frame this decision around one number: the monthly mortgage payment versus the monthly rent check. That framing omits most of what actually determines which path costs less over time.
When buying, the upfront costs alone can surprise households that have not prepared. Closing costs in the U.S. typically run between 2 and 5 percent of the purchase price. On a $350,000 home, that is $7,000 to $17,500 paid before a single mortgage payment is made. Property taxes, homeowner's insurance, and private mortgage insurance (PMI, required when a down payment is below 20 percent) are recurring costs that renters do not carry. Maintenance and repairs average roughly 1 percent of a home's value per year, though older homes or those with deferred work can run well above that.
Renters pay none of those items directly, but they do forgo the equity buildup that mortgage payments produce over time. The practical question is whether the equity gain outweighs the accumulated cost difference, and that answer depends heavily on how long a family stays in the home. For a deeper look at how this fits into overall household planning, see our annual family finance checkup.
| Criterion | Renting | Buying |
|---|---|---|
| Upfront cost | Security deposit, first/last month | Down payment plus 2-5% closing costs |
| Monthly cost predictability | Fixed until lease renewal | Fixed principal/interest; taxes and insurance vary |
| Maintenance responsibility | Landlord typically covers | Owner covers all costs |
| Equity buildup | None | Builds with each payment and appreciation |
| Mobility | High; exit at lease end | Low; selling takes time and money |
| Property tax exposure | None directly | Ongoing annual obligation |
| Risk of value loss | None to renter | Owner absorbs market downturns |
What the price-to-rent ratio tells you
The price-to-rent ratio divides the median home purchase price in an area by the annual median rent for a comparable property. A ratio below 15 generally suggests buying may be financially competitive. A ratio above 20 suggests renting is likely the more cost-effective choice in that market.
As of data from the National Association of Realtors and various housing research organizations, many coastal U.S. metros carry ratios well above 25, while interior and Midwest markets often sit in the 12 to 18 range. Families should look up their specific metro area rather than relying on national averages, which mask wide local variation.
5-7 years
Typical break-even horizon for buying
Housing economists generally place the point at which buying becomes cheaper than renting at five to seven years in most U.S. markets, though local conditions shift this range.
2-5%
Typical closing cost range for home buyers
The Consumer Financial Protection Bureau notes that closing costs on a home purchase commonly fall between 2 and 5 percent of the loan amount.
~1%
Annual maintenance cost estimate for homeowners
A widely cited rule of thumb holds that homeowners should budget roughly 1 percent of a home's purchase price per year for maintenance and repairs.
This ratio is a starting point, not a verdict. It does not account for expected rent increases, potential home appreciation, local tax deductions available to homeowners, or individual investment returns a renter might earn by keeping their down payment in the market. Those variables all shift the final number.
Before building a household budget that can absorb either path, it helps to have the fundamentals in place. Our guide to building a household budget from zero covers exactly that ground.
The break-even point and why it matters
The break-even point is the number of years a buyer must stay in a home before the total cost of buying falls below the total cost of renting an equivalent property. It typically runs between five and seven years in most U.S. markets, though it can stretch longer in high price-to-rent areas or shrink in low-cost markets with fast appreciation.
A family that buys and sells at year three will almost certainly lose money relative to renting, after accounting for closing costs on both the purchase and the sale. A family that stays fifteen years in the same home is very likely to come out ahead, assuming modest appreciation and stable income throughout.
Credit standing affects this calculation directly. A buyer with a lower credit score pays a higher interest rate, which raises the total cost of ownership and pushes the break-even point further out. Families who are uncertain about how their credit history affects their borrowing power can review the basics with our breakdown of credit score misconceptions.
Hidden costs on both sides of the ledger
Owners carry costs renters often underestimate when observing from the outside. A new roof can run $8,000 to $15,000 or more depending on square footage and materials. HVAC replacement, plumbing failures, and foundation issues are not rare events over a 10 to 15 year ownership window. The trade-offs between DIY repairs and hiring a contractor are worth understanding before assuming ownership costs will stay low.
Renters, on the other hand, carry opportunity costs that owners avoid. A $60,000 down payment kept in a diversified investment account rather than put toward a home purchase could generate a meaningful return over time, though investment returns are variable and not guaranteed. Renters also face the risk of rent increases at each lease renewal, which reduces their cost predictability over the long term.
Neither side of this ledger is inherently better. The decision is a function of local market conditions, household stability, savings reserves, and how long a family realistically expects to stay in one place. Families should consult a licensed financial adviser before committing to either path, particularly when a mortgage represents a large share of household income.
This article is for general informational purposes only and does not constitute financial or investment advice. Consult a qualified, licensed financial professional before making decisions about home purchase or long-term financial planning.